The candlestick patterns are the soul of technical analysis. You can not make money in the forex market without learning candlestick patterns. The future price movement can easily be predicted with the help of candlestick patterns. You can build your own strategy with the help of candlestick patterns.
Candlestick patterns are formed with single or multiple candles. You just need the right vision to recognize those patterns on the chart. If you are able to do that, no doubt you can make a lot of money in the forex market.
You can build your own trading strategy with the combination of candlestick and chart patterns. On this website, we have revealed our secret forex trading strategies you can also try them. We are sure you would love them!
What are candlestick patterns?
In the forex market, certain patterns are formed based on the trader’s emotions. There are both buyers and sellers in the market. When the price comes to a certain level, buyers or sellers jump into the market and start buying or selling the stock based on their prediction.
When the majority of people buy stocks, some bullish patterns are formed on the chart. After seeing the bullish patterns, more buyers enter the market and take the price up.
Similarly, if there are more sellers than buyers, they start selling the stock, and some bearish patterns are formed. After seeing the bearish patterns, the previous buyers start squaring off their positions and new sellers enter the market and take the price down.
We should use candlestick patterns because it indicates the strength of buyers or sellers so it helps us to take our buy/sell decision.
How to read candlestick patterns?
In order to read the candlestick patterns, first you need to understand the candle.
The candle is formed based on 4 types of prices.
- Opening price
- Closing price
- High price
- Low price
If we draw a figure based on these prices, we get a candle-like structure. That is why it is called candlestick.
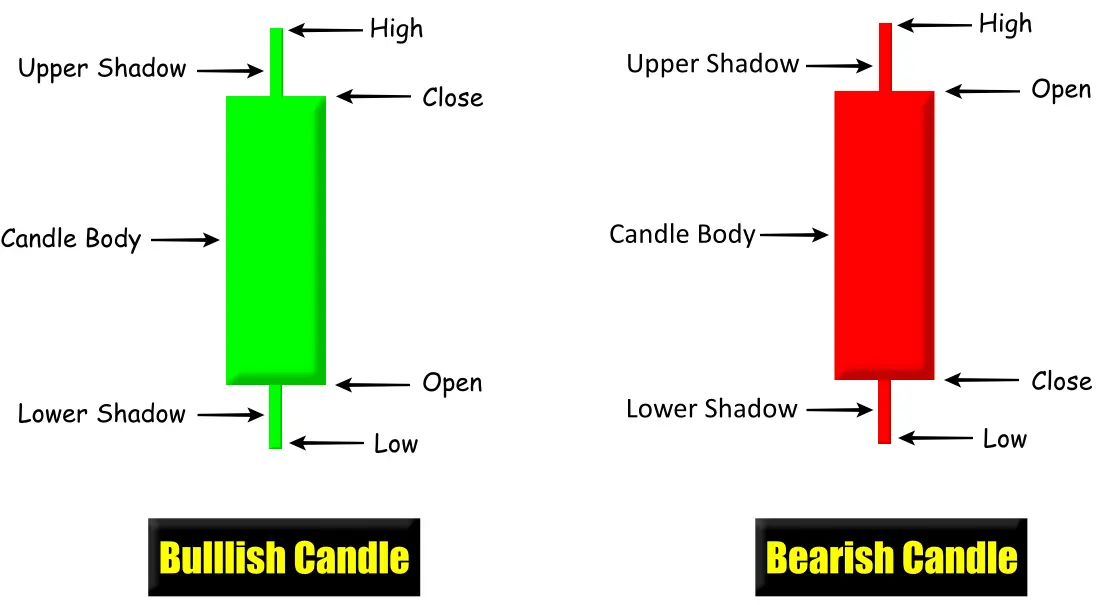
Parts of candlestick
Candlestick is made up of two parts.
- Candle body
- wick or shadow
Candle body indicates the difference between opening and closing prices while wicks show the high and low points of the price for the particular time period.
When the shadow is formed above the candle body, we call it the upper shadow and when the shadow is created below the candle, we call it a lower shadow.
The candle can be red or green. The color of the candle is depending on the opening and closing price. If the closing price is greater than the opening price, the closer of the candle is green, and when the closing price is less than the opening price the color of the candle is red.
During the trading session, when the price reaches a certain level but does not sustain and comes down, then the upper shadow forms, and when the price reaches the lowest level but pulls back from that level then the lower shadow forms.
Before learning the candlestick patterns, you should keep these points in your mind.
- A green or white candle represents the buyer’s strength in the market.
- A Red or black candle represents the seller’s strength in the market.
- When the opening price is lower than the closing price, the green candle forms.
- When the opening price is higher than the closing price, the red candle forms.
- The body of the candle shows the strength of the buyers/sellers.
- Wicks indicate the price rejection.
How many candlestick patterns are there?
There are 36 known candlestick patterns that we have been using traditionally but some experts are still inventing new patterns so this count is not final.
What are the types of candlestick patterns?
There are two major types of candlestick patterns.
- Trend reversal patterns
- Trend continuation patterns
Trend reversal patterns are further divided into two sub-types.
- Bullish trend reversal patterns
- Bearish trend reversal patterns
likewise, Trend continuation patterns are also divided into two sub-types.
- Bullish trend continuation pattern
- Bearish trend continuation pattern
What is the meaning of bullish reversal candlestick patterns?
The meaning of a bullish reversal is, the current downtrend in the market is about to finish and the uptrend will start so if you want to buy the stock in the market, you should follow the bullish reversal candlestick patterns.
What is the meaning of bearish reversal candlestick patterns?
The meaning of a bearish reversal is, the current uptrend in the market is about to finish and the downtrend will start so if you want to sell the stock in the market, you should follow the bullish reversal candlestick patterns.
All Candlestick Patterns
We have divided all candlestick patterns into four subcategories namely 1. bullish reversal candlestick patterns, 2. bearish reversal candlestick patterns, 3. bullish continuation candlestick patterns, and 4. bearish continuation candlestick patterns.
Bullish reversal candlestick patterns
-
Hammer
Hammer is one of the most popular bullish reversal candlestick patterns. This pattern is formed with a single candle only. It appears at the end of the downtrend. A valid hammer pattern is always formed at the major support level. After seeing the hammer candle, existing sellers exit their short position and new buyers enter the market and take the price higher.
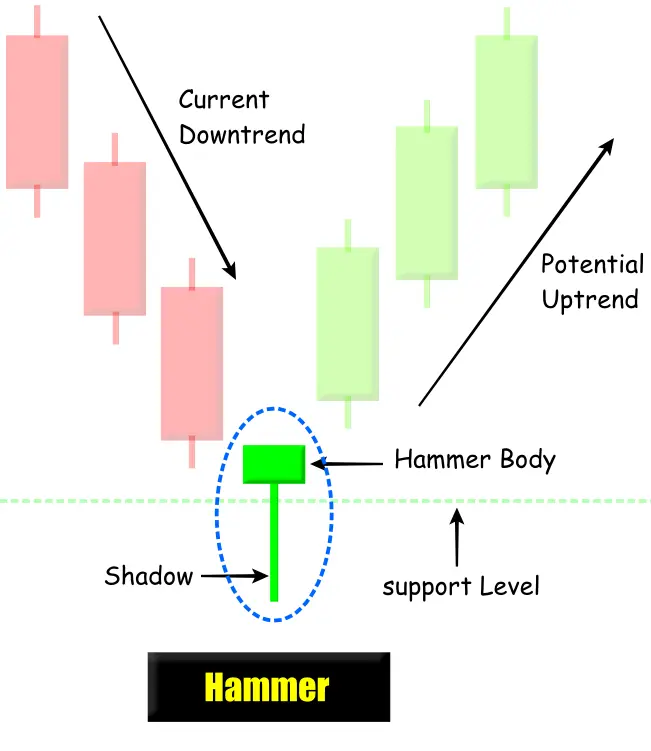
The body of the hammer candle should be smaller than its shadow. The size of the shadow should be at least twice the size of the body.
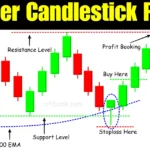
How to trade the hammer pattern?
The hammer pattern can be traded in two ways.
- Buy entry can be placed above the high of the hammer candle
- Buy entry can be placed above the confirmation candle (A more secure way)
The majority of people follow the first approach because profit potential gets reduced in the second approach.
Important Points:
- The market should be in a downtrend before forming the hammer candle.
- A hammer candle should be formed at the major support level.
- The volume of the hammer candle should be higher than its previous candle.
- The color of the hammer candle should be green (Recommended).
- The shadow of the hammer candle should be twice as long as its body.
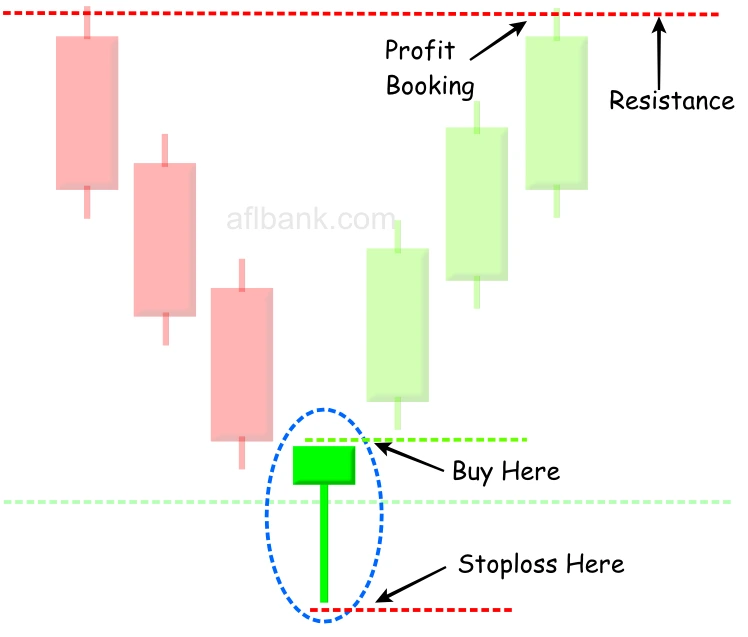
- Buy entry can be placed above the high of the hammer candle.
- Stoploss can be placed below the low of the hammer candle.
- Profit can be booked at the next resistance level.