What is a bullish engulfing candle?
The bullish engulfing candlestick pattern is one of the bullish reversal candlestick patterns. This pattern is formed of two candles.
The bullish engulfing pattern usually appears at the end of the downtrend. This pattern is probably seen at the support level and the trend is reversed after forming this pattern.
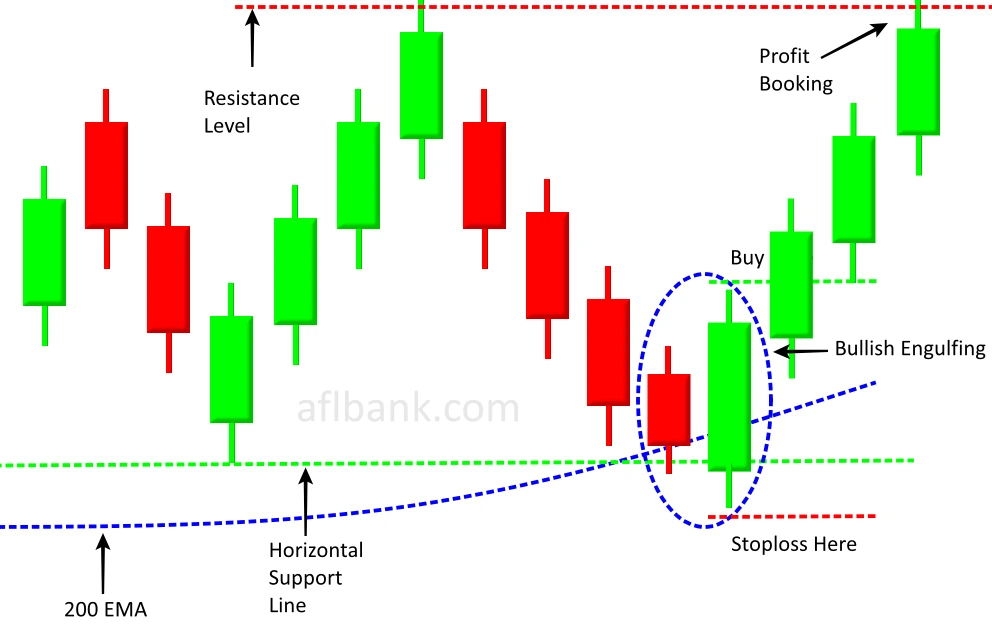
There are two candles involved in this pattern. The first candle is a red bearish candle with a small body. The second candle is a big green body candle that engulfs the body of the first red candle.
In the downtrend, when the price reaches the support level, it starts losing momentum means the size of the candle becomes smaller. This is an indication that sellers are no more interested in selling and they start squaring off their positions also fresh buyers enter at the support level and as a result the big green candle forms that engulf the previous red candle’s body.
After seeing the green candle at a support level, more buyers enter the market and take the price higher.
In a bullish engulfing pattern, we consider the body of candles only and not wicks so the body of the red candle should be engulfed by the body of the green candle. No matter if the wicks of the red candle are out of the engulfing area.
The bullish engulfing candlestick pattern can be traded in any market and in any time frame but it works great in higher time frames like 4 hours or daily.
How to trade a bullish engulfing pattern?
To maximize the winning probability, we should trade this pattern at the pullback in an uptrend. When the price is trading above 200 EMA, it is considered that the trend is up. It is recommended that, do not buy when the price is trading below 200 EMA. Now we have to find the short-term downtrend or pullback that comes up to the support level. If we see the bullish engulfing candle pattern at this level, we should buy it.
1. The price should be trading above 200 EMA.
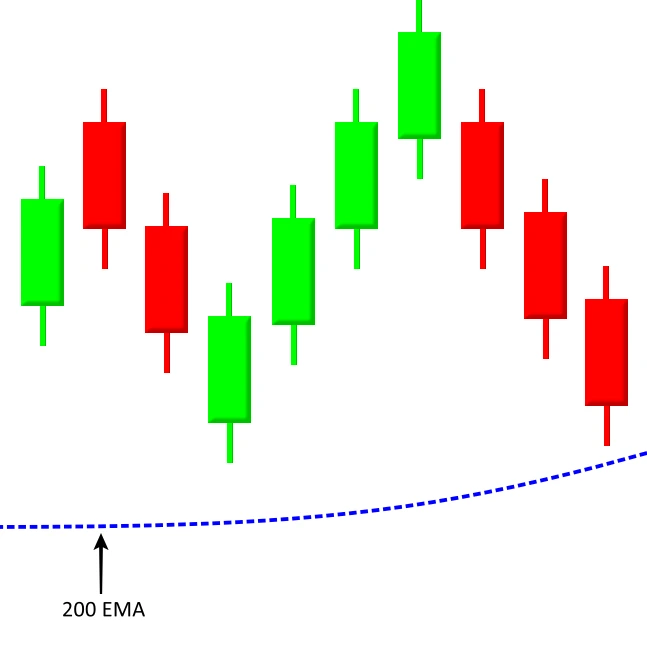
2. Wait for the price to reach the support level. The support level could be horizontal line support, trendline support, or dynamic support like 200 EMA or 50 EMA.
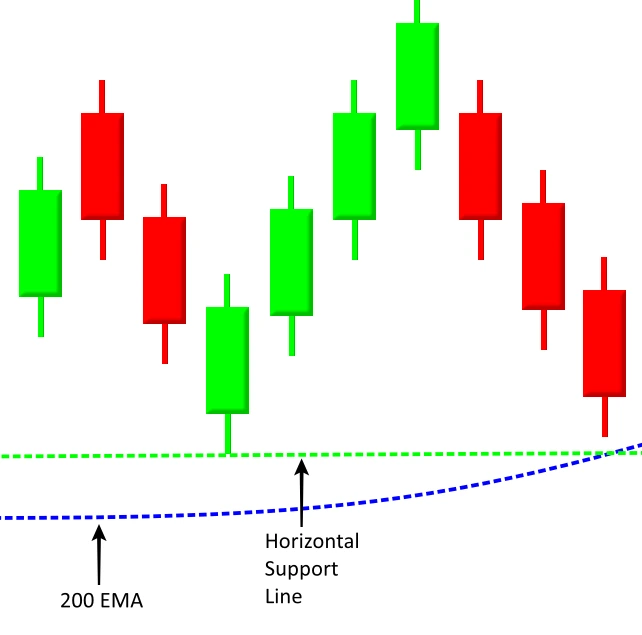
3. Wait for the bullish engulfing candle pattern to be formed.
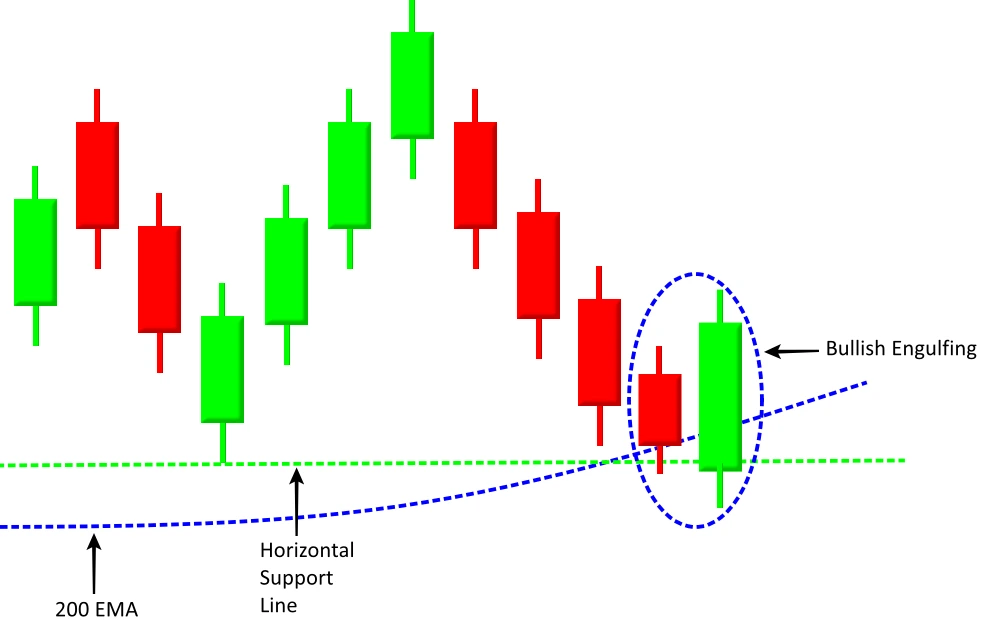
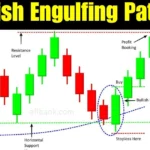
4. Buy entry can be placed above the high of the green candle and stop loss can be placed below the swing low.
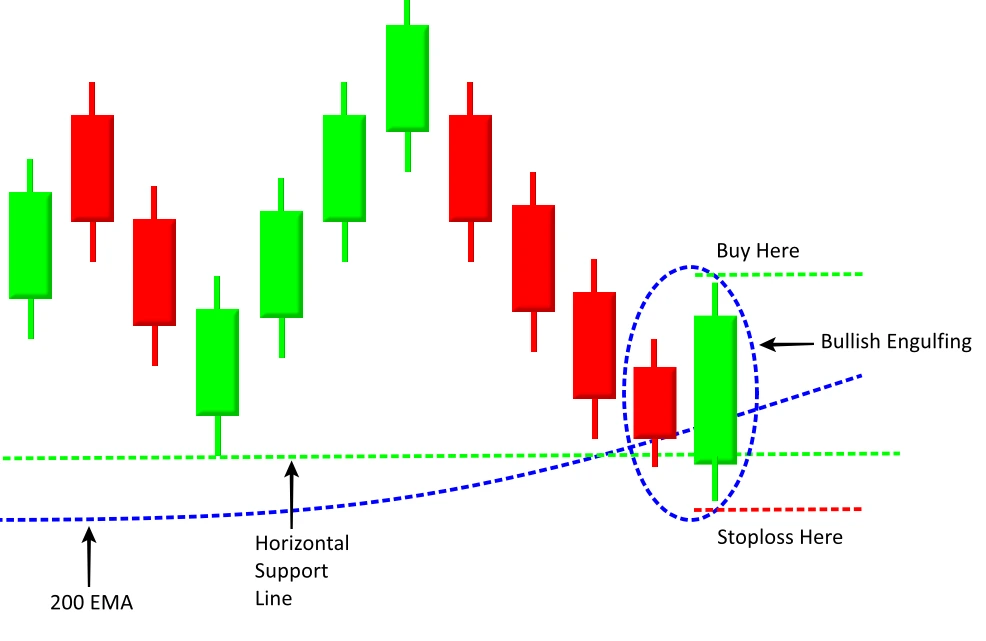
5. Book the profit at the next resistance level.
6. Here is the real chart example.
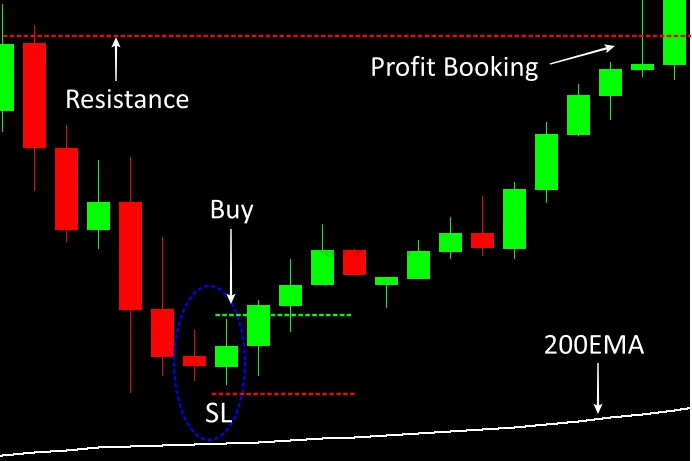
Important points to remember
- The price should be trading above 200 EMA.
- Wait for the price to come at the support level.
- Find the bullish engulfing pattern at the support level.
- The body of the red candle should be completely engulfed by the body of the green candle.
- The volume of the green candle should be higher than the volume of the previous red candle.
- Place the buy order above the high of the green candle.
- Place the stop loss below the swing low.
- Profit can be booked at the next resistance level.
Also, read about hammer candlestick pattern
FAQ – Bullish Engulfing Candlestick Pattern
Q1. What is a bullish engulfing candle?
Bullish engulfing is the candlestick pattern that is formed for two candles. It is one of the most popular bullish reversal patterns. In this pattern, the body of the red candle is completely engulfed by the body of the green candle. This pattern is usually found at the end of the downtrend.
Q2. How to find the bullish engulfing pattern?
The valid bullish engulfing pattern always forms at the support level. After a downtrend, wait for the market to come to a support level and form a bullish engulfing pattern where the body of the first red candle should be completely engulfed by the body of the second green candle.
Q3. where to put a stop after a bullish engulfing candle?
The stop loss can always be put at the swing low means whatever candle makes the lowest low, put the stop loss below the low of that candle.

1 thought on “Bullish Engulfing Candlestick Pattern”